mirror of
https://github.com/grafana/grafana.git
synced 2025-07-29 09:52:35 +08:00
* Add profile-traces intro material; update Pyroscope data source info

* Apply suggestions from code review

Co-authored-by: Jack Baldry <jack.baldry@grafana.com>

* Updates and file rename from review

* Add PYROSCOPE_VERSION

* Apply suggestions from code review

* Format tables

Signed-off-by: Jack Baldry <jack.baldry@grafana.com>

* Apply suggestions from code review

Co-authored-by: Jack Baldry <jack.baldry@grafana.com>
Co-authored-by: Jennifer Villa <jvilla2013@gmail.com>

* Apply suggestions from code review

---------

Signed-off-by: Jack Baldry <jack.baldry@grafana.com>
Co-authored-by: Jack Baldry <jack.baldry@grafana.com>
Co-authored-by: Jennifer Villa <jvilla2013@gmail.com>
86 lines
4.0 KiB
Markdown
86 lines
4.0 KiB
Markdown
---
|
|
aliases:
|
|
- ../features/datasources/phlare/ # /docs/grafana/<GRAFANA_VERSION>/features/datasources/phlare/
|
|
- ../features/datasources/grafana-pyroscope/ # /docs/grafana/<GRAFANA_VERSION>/features/datasources/grafana-pyroscope/
|
|
- ../datasources/grafana-pyroscope/ # /docs/grafana/<GRAFANA_VERSION>/datasources/grafana-pyroscope/
|
|
description: Horizontally-scalable, highly-available, multi-tenant continuous profiling
|
|
aggregation system. OSS profiling solution from Grafana Labs.
|
|
keywords:
|
|
- grafana
|
|
- phlare
|
|
- guide
|
|
- profiling
|
|
- pyroscope
|
|
labels:
|
|
products:
|
|
- cloud
|
|
- enterprise
|
|
- oss
|
|
title: Grafana Pyroscope
|
|
weight: 1150
|
|
---
|
|
|
|
# Grafana Pyroscope data source
|
|
|
|
Grafana Pyroscope is a horizontally scalable, highly available, multi-tenant, OSS, continuous profiling aggregation system. Add it as a data source, and you are ready to query your profiles in [Explore][explore].
|
|
|
|
Refer to [Introduction to Pyroscope](https://grafana.com/docs/pyroscope/<PYROSCOPE_VERSION>/introduction/) to understand profiling and Pyroscope.
|
|
|
|
To use profiling data, you should:
|
|
|
|
- [Configure your application to send profiles](/docs/pyroscope/<PYROSCOPE_VERSION>/configure-client/)
|
|
- [Configure the Grafana Pyroscope data source](./configure-pyroscope-data-source/).
|
|
- [View and query profiling data in Explore](./query-profile-data/)
|
|
|
|
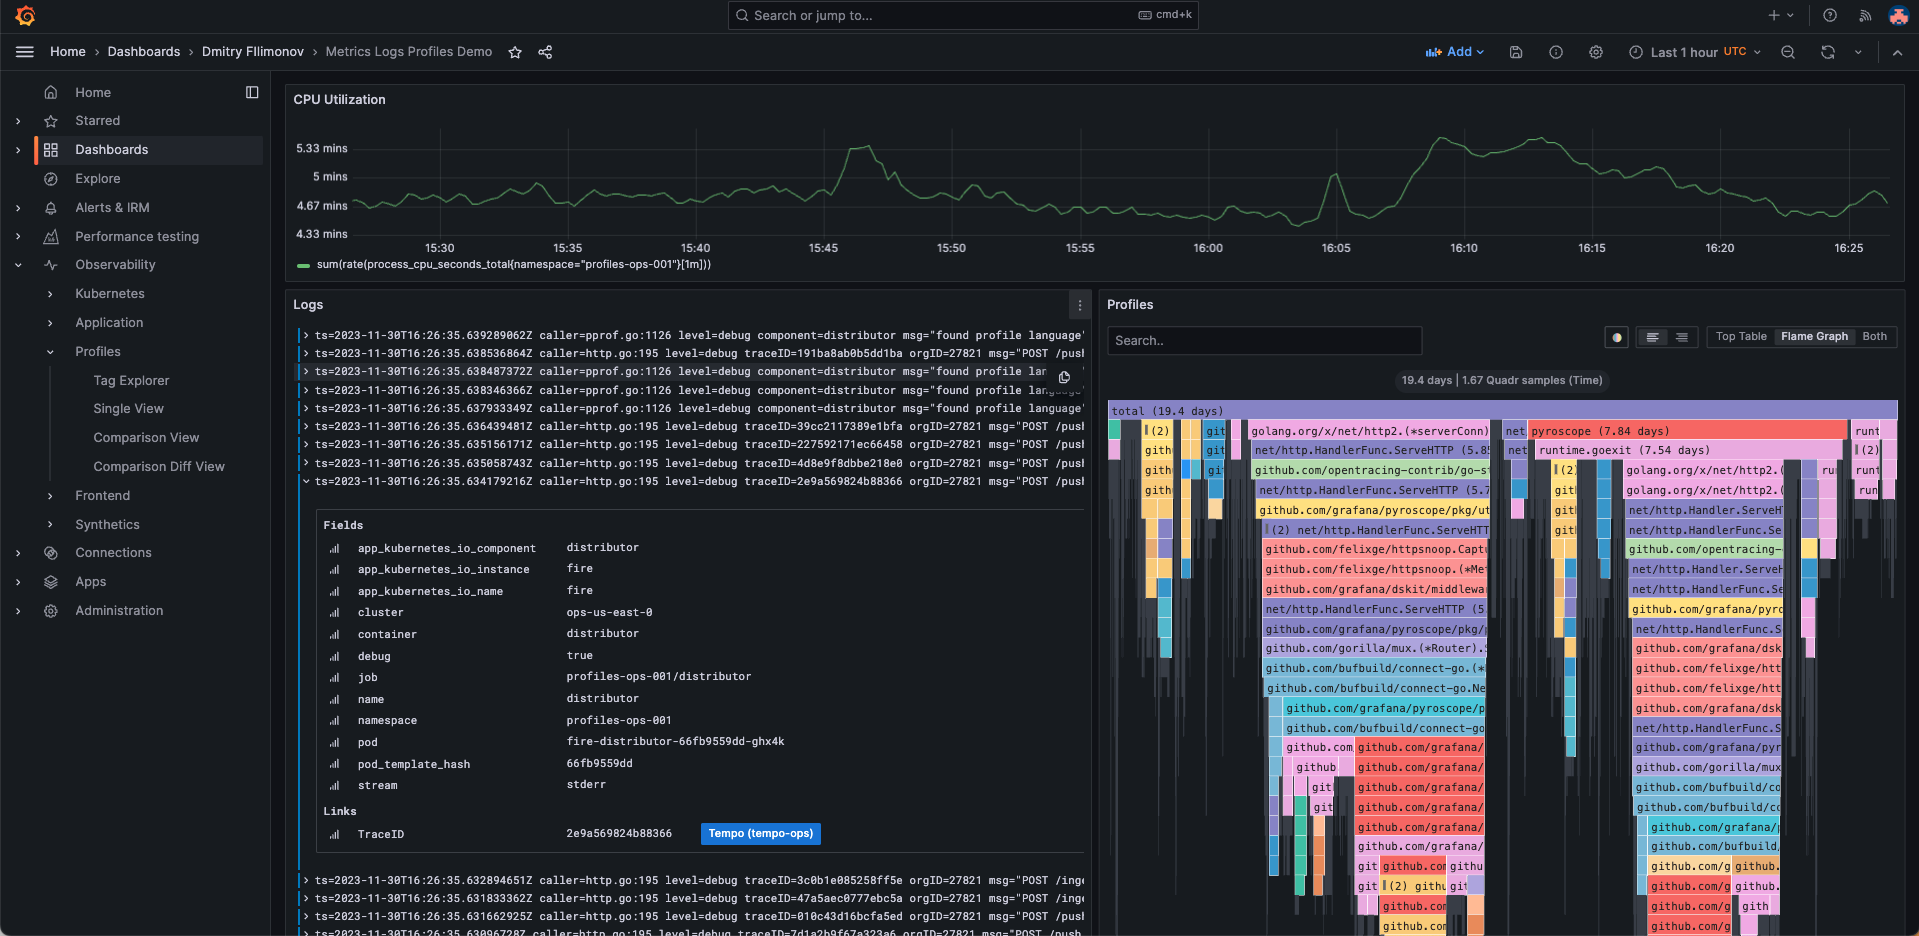
## Integrate profiles into dashboards
|
|
|
|
Using the Pyroscope data source, you can integrate profiles into your dashboards.
|
|
In this case, the screenshot shows memory profiles alongside panels for logs and metrics to be able to debug out of memory (OOM) errors alongside the associated logs and metrics.
|
|
|
|
|
|
|
|
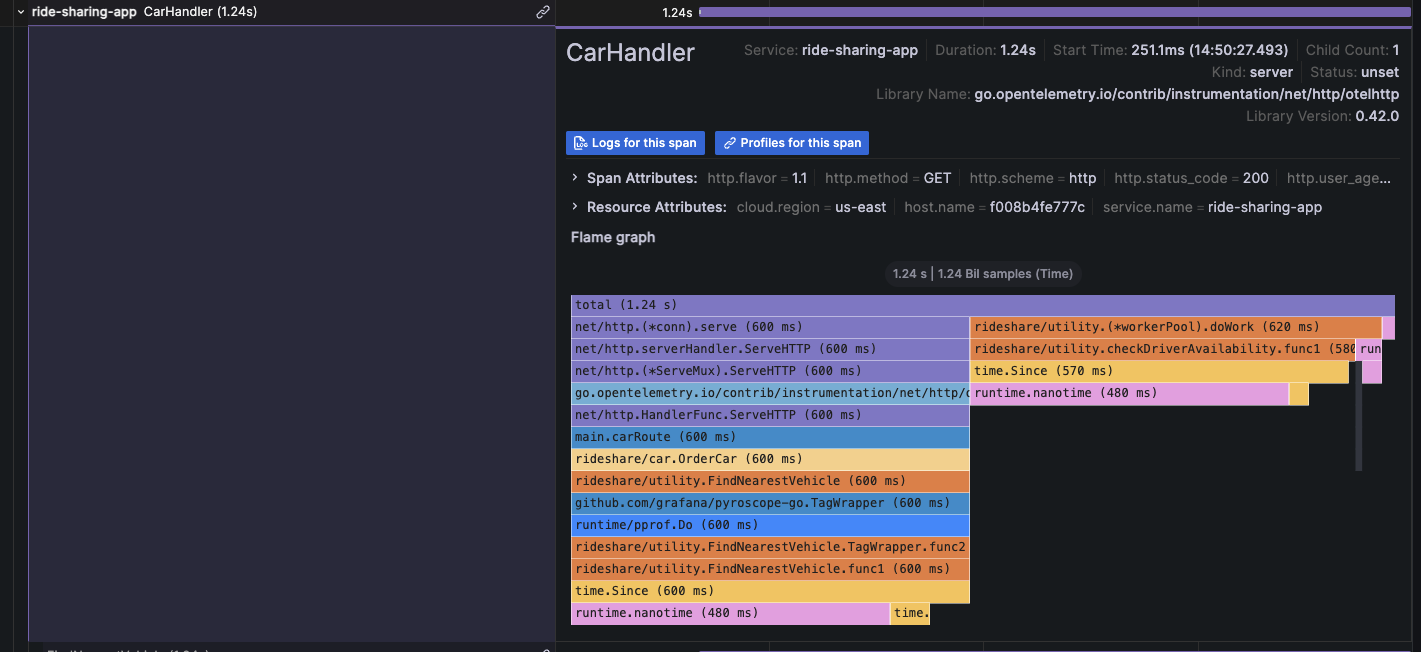
## Visualize traces and profiles data using Traces to profiles
|
|
|
|
You can link profile and tracing data using your Pyroscope data source with the Tempo data source.
|
|
To learn more about how profiles and tracing can work together, refer to [Profiling and tracing synergies](./profiling-and-tracing/).
|
|
|
|
Combined traces and profiles let you see granular line-level detail when available for a trace span. This allows you pinpoint the exact function that's causing a bottleneck in your application as well as a specific request.
|
|
|
|
|
|
|
|
For more information, refer to the [Traces to profile section][configure-tempo-data-source] and [Link tracing and profiling with span profiles](https://grafana.com/docs/pyroscope/<PYROSCOPE_VERSION>/configure-client/trace-span-profiles/).
|
|
|
|
{{< youtube id="AG8VzfFMLxo" >}}
|
|
|
|
## Provision the Grafana Pyroscope data source
|
|
|
|
You can modify the Grafana configuration files to provision the Grafana Pyroscope data source.
|
|
To learn more, and to view the available provisioning settings, refer to [provisioning documentation][provisioning-data-sources].
|
|
|
|
Here is an example configuration:
|
|
|
|
```yaml
|
|
apiVersion: 1
|
|
|
|
datasources:
|
|
- name: Grafana Pyroscope
|
|
type: grafana-pyroscope-datasource
|
|
url: http://localhost:4040
|
|
jsonData:
|
|
minStep: '15s'
|
|
```
|
|
|
|
{{% docs/reference %}}
|
|
[explore]: "/docs/grafana/ -> /docs/grafana/<GRAFANA VERSION>/explore"
|
|
[explore]: "/docs/grafana-cloud/ -> /docs/grafana/<GRAFANA VERSION>/explore"
|
|
|
|
[flame-graph]: "/docs/grafana/ -> /docs/grafana/<GRAFANA VERSION>/panels-visualizations/visualizations/flame-graph"
|
|
[flame-graph]: "/docs/grafana-cloud/ -> /docs/grafana/<GRAFANA VERSION>/panels-visualizations/visualizations/flame-graph"
|
|
|
|
[provisioning-data-sources]: "/docs/grafana/ -> /docs/grafana/<GRAFANA VERSION>/administration/provisioning#datasources"
|
|
[provisioning-data-sources]: "/docs/grafana-cloud/ -> /docs/grafana/<GRAFANA VERSION>/administration/provisioning#datasources"
|
|
|
|
[configure-tempo-data-source]: "/docs/grafana/ -> /docs/grafana/<GRAFANA VERSION>/datasources/tempo/configure-tempo-data-source"
|
|
[configure-tempo-data-source]: "/docs/grafana-cloud/ -> docs/grafana-cloud/connect-externally-hosted/data-sources/tempo/configure-tempo-data-source"
|
|
{{% /docs/reference %}}
|