mirror of
https://github.com/ecomfe/vue-echarts.git
synced 2025-08-14 19:23:28 +08:00
* chore: up version and deps

* chore: use pnpm CLI to get versions

* add note for echarts 6 upgrade guide

* remove docs script

let cdn to redirect for us

* Revert "remove docs script"

This reverts commit 3bc237db9100864f2813249ac1693735a658e646.

* update demo links
441 lines
17 KiB
Markdown
441 lines
17 KiB
Markdown
<h1 align="center">Vue-ECharts</h1>
|
|
|
|
<p align="center">Vue.js component for Apache ECharts™.</p>
|
|
<p align="center"><a href="https://npmjs.com/package/vue-echarts"><img alt="npm version" src="https://img.shields.io/npm/v/vue-echarts"></a> <a href="https://vue-echarts.dev/"><img src="https://img.shields.io/badge/Demo%20%C2%BB-20c3aa" alt="View demo"></a> <a href="./README.zh-Hans.md"><img src="https://img.shields.io/badge/%E4%B8%AD%E6%96%87%E7%89%88%20%C2%BB-000" alt="前往中文版"></a></p>
|
|
<p align="center"><a href="https:///pr.new/ecomfe/vue-echarts"><img alt="Open in Codeflow" src="https://developer.stackblitz.com/img/open_in_codeflow.svg" height="28"></a> <a href="https://codesandbox.io/p/github/ecomfe/vue-echarts"><img alt="Edit in CodeSandbox" src="https://assets.codesandbox.io/github/button-edit-lime.svg" height="28"></a></p>
|
|
|
|
---
|
|
|
|
> Still using Vue 2? Read v7 docs [here →](https://github.com/ecomfe/vue-echarts/tree/7.x)
|
|
|
|
## Installation & Usage
|
|
|
|
### npm
|
|
|
|
```sh
|
|
npm install echarts vue-echarts
|
|
```
|
|
|
|
#### Example
|
|
|
|
<details>
|
|
<summary>Vue 3 <a href="https://stackblitz.com/edit/vue-echarts-8?file=src%2FApp.vue">Demo →</a></summary>
|
|
|
|
```vue
|
|
<template>
|
|
<v-chart class="chart" :option="option" />
|
|
</template>
|
|
|
|
<script setup>
|
|
import { use } from "echarts/core";
|
|
import { CanvasRenderer } from "echarts/renderers";
|
|
import { PieChart } from "echarts/charts";
|
|
import {
|
|
TitleComponent,
|
|
TooltipComponent,
|
|
LegendComponent,
|
|
} from "echarts/components";
|
|
import VChart, { THEME_KEY } from "vue-echarts";
|
|
import { ref, provide } from "vue";
|
|
|
|
use([
|
|
CanvasRenderer,
|
|
PieChart,
|
|
TitleComponent,
|
|
TooltipComponent,
|
|
LegendComponent,
|
|
]);
|
|
|
|
provide(THEME_KEY, "dark");
|
|
|
|
const option = ref({
|
|
title: {
|
|
text: "Traffic Sources",
|
|
left: "center",
|
|
},
|
|
tooltip: {
|
|
trigger: "item",
|
|
formatter: "{a} <br/>{b} : {c} ({d}%)",
|
|
},
|
|
legend: {
|
|
orient: "vertical",
|
|
left: "left",
|
|
data: ["Direct", "Email", "Ad Networks", "Video Ads", "Search Engines"],
|
|
},
|
|
series: [
|
|
{
|
|
name: "Traffic Sources",
|
|
type: "pie",
|
|
radius: "55%",
|
|
center: ["50%", "60%"],
|
|
data: [
|
|
{ value: 335, name: "Direct" },
|
|
{ value: 310, name: "Email" },
|
|
{ value: 234, name: "Ad Networks" },
|
|
{ value: 135, name: "Video Ads" },
|
|
{ value: 1548, name: "Search Engines" },
|
|
],
|
|
emphasis: {
|
|
itemStyle: {
|
|
shadowBlur: 10,
|
|
shadowOffsetX: 0,
|
|
shadowColor: "rgba(0, 0, 0, 0.5)",
|
|
},
|
|
},
|
|
},
|
|
],
|
|
});
|
|
</script>
|
|
|
|
<style scoped>
|
|
.chart {
|
|
height: 400px;
|
|
}
|
|
</style>
|
|
```
|
|
|
|
</details>
|
|
|
|
> [!IMPORTANT]
|
|
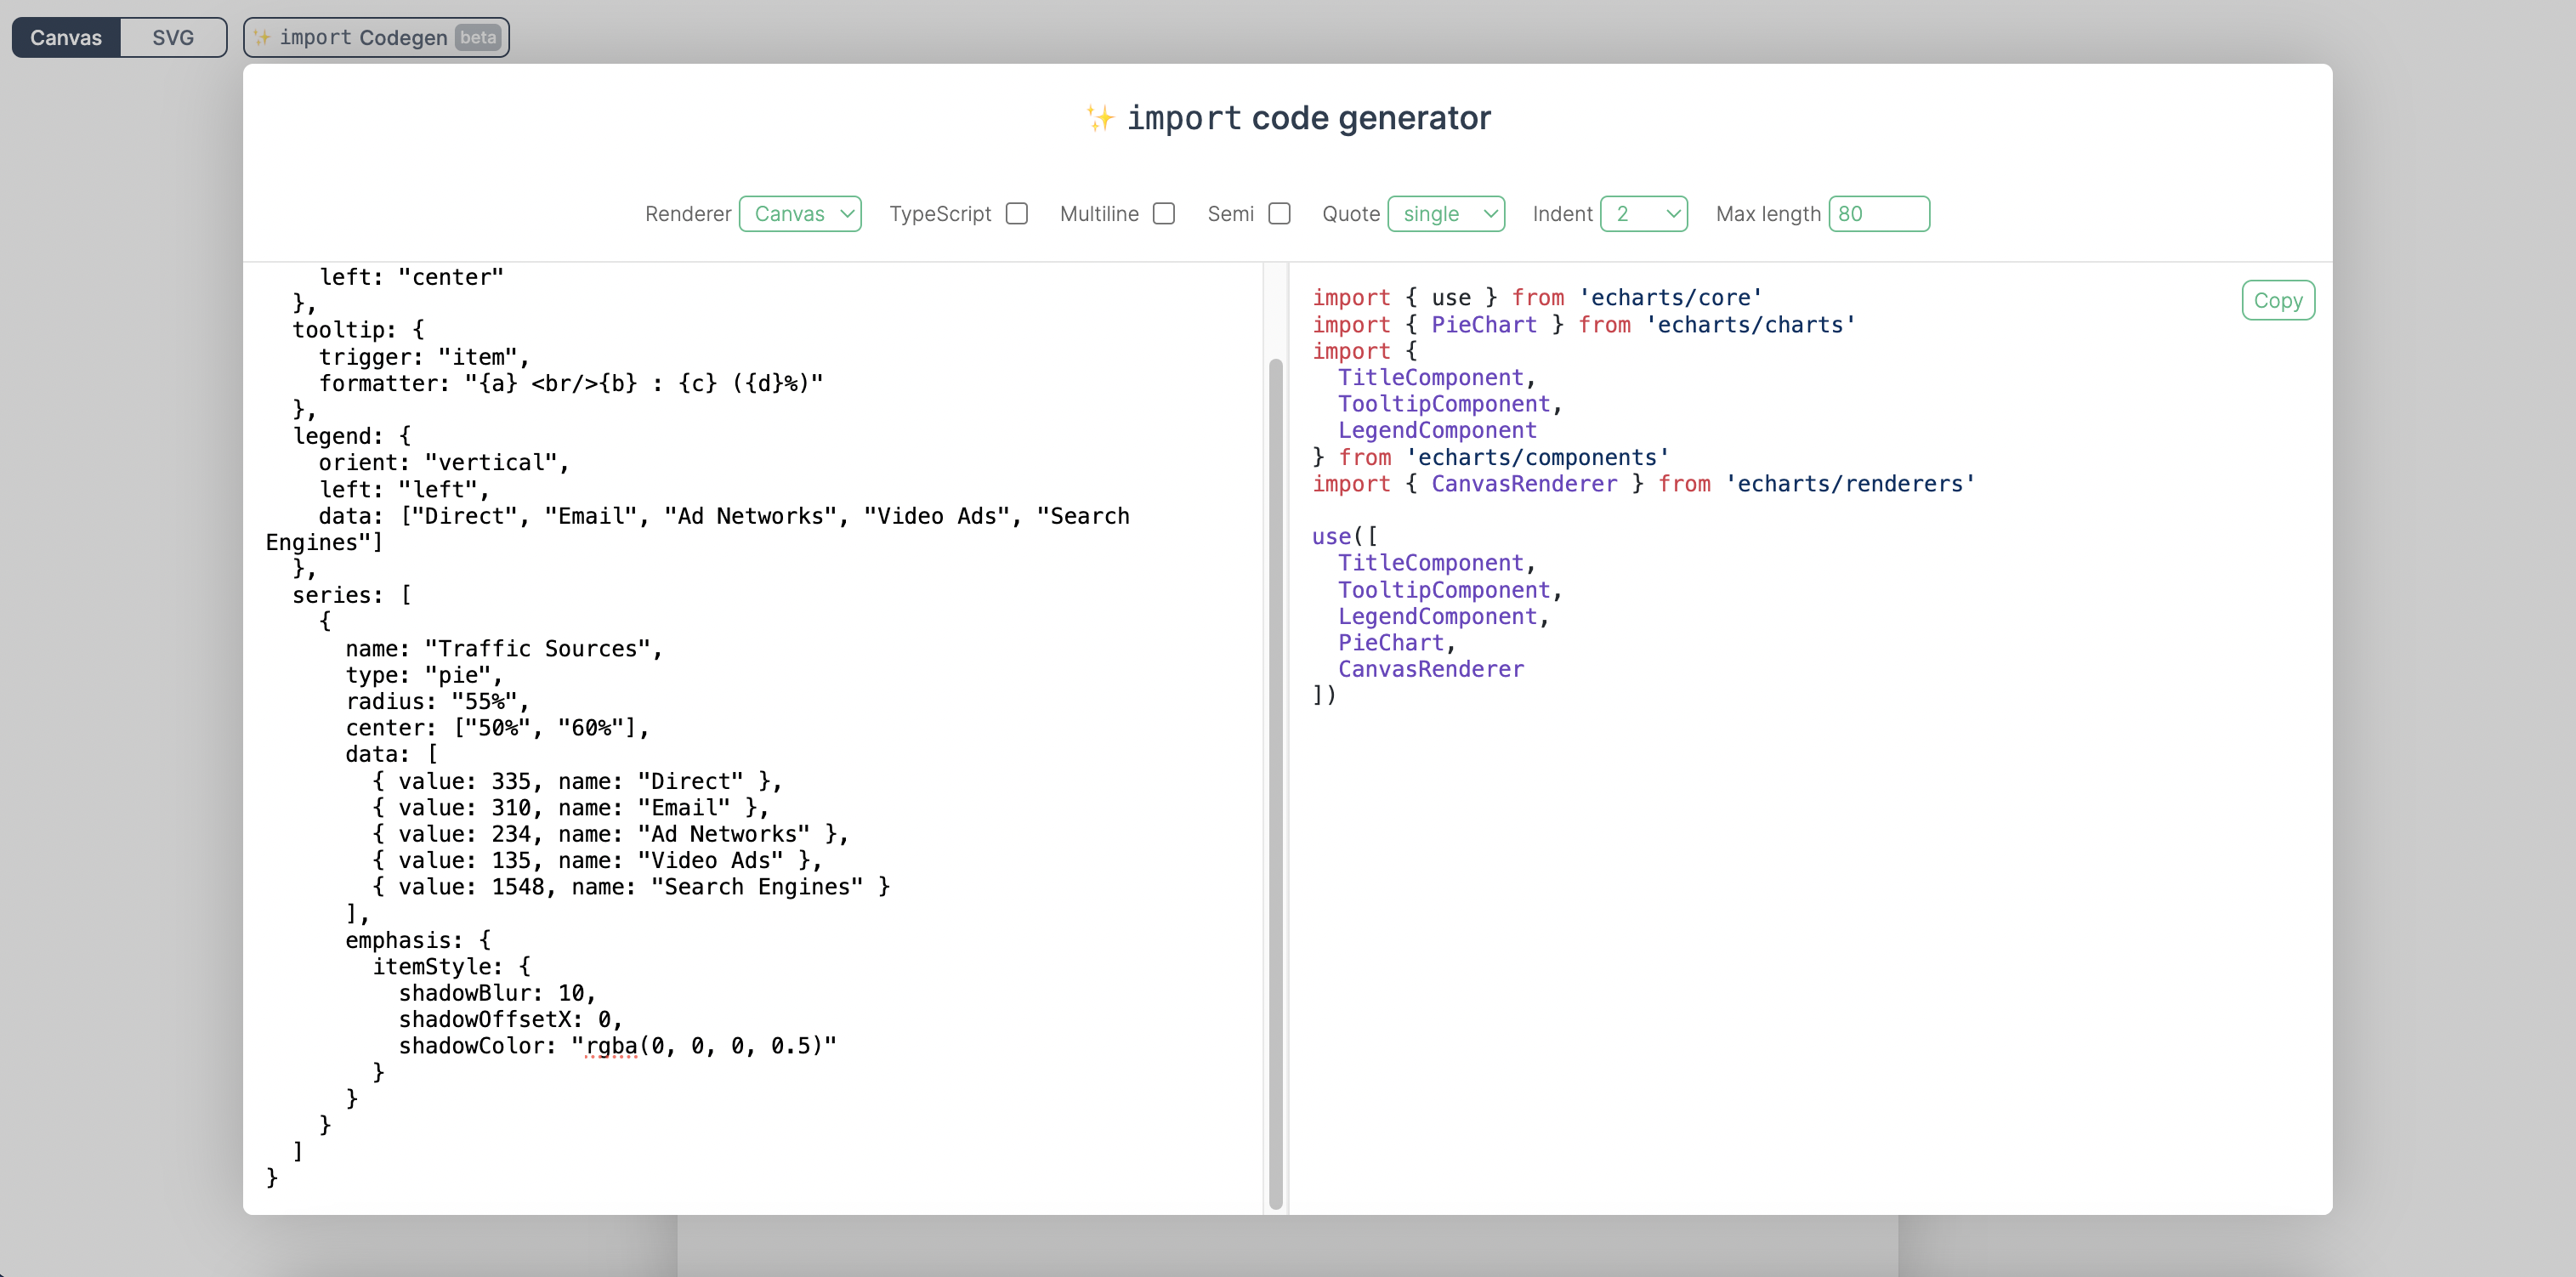
> We encourage manually importing components and charts from ECharts for smaller bundle size. We've built an [import code generator](https://vue-echarts.dev/#codegen) to help you with that. You can just paste in your `option` code and we'll generate the precise import code for you.
|
|
>
|
|
> 
|
|
>
|
|
> [Try it →](https://vue-echarts.dev/#codegen)
|
|
|
|
But if you really want to import the whole ECharts bundle without having to import modules manually, just add this in your code:
|
|
|
|
```js
|
|
import "echarts";
|
|
```
|
|
|
|
### CDN
|
|
|
|
Drop `<script>` inside your HTML file and access the component via `window.VueECharts`.
|
|
|
|
<details>
|
|
<summary>Vue 3 <a href="https://stackblitz.com/edit/vue-echarts-8-global?file=index.html">Demo →</a></summary>
|
|
|
|
<!-- vue3Scripts:start -->
|
|
|
|
```html
|
|
<script src="https://cdn.jsdelivr.net/npm/echarts@6.0.0"></script>
|
|
<script src="https://cdn.jsdelivr.net/npm/vue@3.5.18"></script>
|
|
<script src="https://cdn.jsdelivr.net/npm/vue-echarts@8.0.0-beta.1"></script>
|
|
```
|
|
|
|
<!-- vue3Scripts:end -->
|
|
|
|
```js
|
|
const app = Vue.createApp(...)
|
|
|
|
// register globally (or you can do it locally)
|
|
app.component('v-chart', VueECharts)
|
|
```
|
|
|
|
</details>
|
|
|
|
See more examples [here](https://github.com/ecomfe/vue-echarts/tree/main/demo).
|
|
|
|
### Props
|
|
|
|
- `init-options: object`
|
|
|
|
Optional chart init configurations. See `echarts.init`'s `opts` parameter [here →](https://echarts.apache.org/en/api.html#echarts.init)
|
|
|
|
Injection key: `INIT_OPTIONS_KEY`.
|
|
|
|
- `theme: string | object`
|
|
|
|
Theme to be applied. See `echarts.init`'s `theme` parameter [here →](https://echarts.apache.org/en/api.html#echarts.init)
|
|
|
|
Injection key: `THEME_KEY`.
|
|
|
|
- `option: object`
|
|
|
|
ECharts' universal interface. Modifying this prop will trigger ECharts' `setOption` method. Read more [here →](https://echarts.apache.org/en/option.html)
|
|
|
|
> [!TIP]
|
|
> When `update-options` is not specified, `notMerge: false` will be specified by default when the `setOption` method is called if the `option` object is modified directly and the reference remains unchanged; otherwise, if a new reference is bound to `option`, `notMerge: true` will be specified.
|
|
|
|
- `update-options: object`
|
|
|
|
Options for updating chart option. See `echartsInstance.setOption`'s `opts` parameter [here →](https://echarts.apache.org/en/api.html#echartsInstance.setOption)
|
|
|
|
Injection key: `UPDATE_OPTIONS_KEY`.
|
|
|
|
- `group: string`
|
|
|
|
Group name to be used in chart [connection](https://echarts.apache.org/en/api.html#echarts.connect). See `echartsInstance.group` [here →](https://echarts.apache.org/en/api.html#echartsInstance.group)
|
|
|
|
- `autoresize: boolean | { throttle?: number, onResize?: () => void }` (default: `false`)
|
|
|
|
Whether the chart should be resized automatically whenever its root is resized. Use the options object to specify a custom throttle delay (in milliseconds) and/or an extra resize callback function.
|
|
|
|
- `loading: boolean` (default: `false`)
|
|
|
|
Whether the chart is in loading state.
|
|
|
|
- `loading-options: object`
|
|
|
|
Configuration item of loading animation. See `echartsInstance.showLoading`'s `opts` parameter [here →](https://echarts.apache.org/en/api.html#echartsInstance.showLoading)
|
|
|
|
Injection key: `LOADING_OPTIONS_KEY`.
|
|
|
|
- `manual-update: boolean` (default: `false`)
|
|
|
|
For performance critical scenarios (having a large dataset) we'd better bypass Vue's reactivity system for `option` prop. By specifying `manual-update` prop with `true` and not providing `option` prop, the dataset won't be watched any more. After doing so, you need to retrieve the component instance with `ref` and manually call `setOption` method to update the chart.
|
|
|
|
### Events
|
|
|
|
You can bind events with Vue's `v-on` directive.
|
|
|
|
```vue
|
|
<template>
|
|
<v-chart :option="option" @highlight="handleHighlight" />
|
|
</template>
|
|
```
|
|
|
|
> [!NOTE]
|
|
> Only the `.once` event modifier is supported as other modifiers are tightly coupled with the DOM event system.
|
|
|
|
Vue-ECharts support the following events:
|
|
|
|
- `highlight` [→](https://echarts.apache.org/en/api.html#events.highlight)
|
|
- `downplay` [→](https://echarts.apache.org/en/api.html#events.downplay)
|
|
- `selectchanged` [→](https://echarts.apache.org/en/api.html#events.selectchanged)
|
|
- `legendselectchanged` [→](https://echarts.apache.org/en/api.html#events.legendselectchanged)
|
|
- `legendselected` [→](https://echarts.apache.org/en/api.html#events.legendselected)
|
|
- `legendunselected` [→](https://echarts.apache.org/en/api.html#events.legendunselected)
|
|
- `legendselectall` [→](https://echarts.apache.org/en/api.html#events.legendselectall)
|
|
- `legendinverseselect` [→](https://echarts.apache.org/en/api.html#events.legendinverseselect)
|
|
- `legendscroll` [→](https://echarts.apache.org/en/api.html#events.legendscroll)
|
|
- `datazoom` [→](https://echarts.apache.org/en/api.html#events.datazoom)
|
|
- `datarangeselected` [→](https://echarts.apache.org/en/api.html#events.datarangeselected)
|
|
- `timelinechanged` [→](https://echarts.apache.org/en/api.html#events.timelinechanged)
|
|
- `timelineplaychanged` [→](https://echarts.apache.org/en/api.html#events.timelineplaychanged)
|
|
- `restore` [→](https://echarts.apache.org/en/api.html#events.restore)
|
|
- `dataviewchanged` [→](https://echarts.apache.org/en/api.html#events.dataviewchanged)
|
|
- `magictypechanged` [→](https://echarts.apache.org/en/api.html#events.magictypechanged)
|
|
- `geoselectchanged` [→](https://echarts.apache.org/en/api.html#events.geoselectchanged)
|
|
- `geoselected` [→](https://echarts.apache.org/en/api.html#events.geoselected)
|
|
- `geounselected` [→](https://echarts.apache.org/en/api.html#events.geounselected)
|
|
- `axisareaselected` [→](https://echarts.apache.org/en/api.html#events.axisareaselected)
|
|
- `brush` [→](https://echarts.apache.org/en/api.html#events.brush)
|
|
- `brushEnd` [→](https://echarts.apache.org/en/api.html#events.brushEnd)
|
|
- `brushselected` [→](https://echarts.apache.org/en/api.html#events.brushselected)
|
|
- `globalcursortaken` [→](https://echarts.apache.org/en/api.html#events.globalcursortaken)
|
|
- `rendered` [→](https://echarts.apache.org/en/api.html#events.rendered)
|
|
- `finished` [→](https://echarts.apache.org/en/api.html#events.finished)
|
|
- Mouse events
|
|
- `click` [→](https://echarts.apache.org/en/api.html#events.Mouse%20events.click)
|
|
- `dblclick` [→](https://echarts.apache.org/en/api.html#events.Mouse%20events.dblclick)
|
|
- `mouseover` [→](https://echarts.apache.org/en/api.html#events.Mouse%20events.mouseover)
|
|
- `mouseout` [→](https://echarts.apache.org/en/api.html#events.Mouse%20events.mouseout)
|
|
- `mousemove` [→](https://echarts.apache.org/en/api.html#events.Mouse%20events.mousemove)
|
|
- `mousedown` [→](https://echarts.apache.org/en/api.html#events.Mouse%20events.mousedown)
|
|
- `mouseup` [→](https://echarts.apache.org/en/api.html#events.Mouse%20events.mouseup)
|
|
- `globalout` [→](https://echarts.apache.org/en/api.html#events.Mouse%20events.globalout)
|
|
- `contextmenu` [→](https://echarts.apache.org/en/api.html#events.Mouse%20events.contextmenu)
|
|
- ZRender events
|
|
- `zr:click`
|
|
- `zr:mousedown`
|
|
- `zr:mouseup`
|
|
- `zr:mousewheel`
|
|
- `zr:dblclick`
|
|
- `zr:contextmenu`
|
|
|
|
See supported events [here →](https://echarts.apache.org/en/api.html#events)
|
|
|
|
#### Native DOM Events
|
|
|
|
As Vue-ECharts binds events to the ECharts instance by default, there is some caveat when using native DOM events. You need to prefix the event name with `native:` to bind native DOM events.
|
|
|
|
```vue
|
|
<template>
|
|
<v-chart @native:click="handleClick" />
|
|
</template>
|
|
```
|
|
|
|
### Provide / Inject
|
|
|
|
Vue-ECharts provides provide/inject API for `theme`, `init-options`, `update-options` and `loading-options` to help configuring contextual options. eg. for `theme` you can use the provide API like this:
|
|
|
|
<details>
|
|
<summary>Composition API</summary>
|
|
|
|
```js
|
|
import { THEME_KEY } from "vue-echarts";
|
|
import { provide } from "vue";
|
|
|
|
provide(THEME_KEY, "dark");
|
|
|
|
// or provide a ref
|
|
const theme = ref("dark");
|
|
provide(THEME_KEY, theme);
|
|
|
|
// getter is also supported
|
|
provide(THEME_KEY, () => theme.value);
|
|
```
|
|
|
|
</details>
|
|
|
|
<details>
|
|
<summary>Options API</summary>
|
|
|
|
```js
|
|
import { THEME_KEY } from 'vue-echarts'
|
|
import { computed } from 'vue'
|
|
|
|
export default {
|
|
{
|
|
provide: {
|
|
[THEME_KEY]: 'dark'
|
|
}
|
|
}
|
|
}
|
|
|
|
// Or make injections reactive
|
|
export default {
|
|
data() {
|
|
return {
|
|
theme: 'dark'
|
|
}
|
|
},
|
|
provide() {
|
|
return {
|
|
[THEME_KEY]: computed(() => this.theme)
|
|
}
|
|
}
|
|
}
|
|
```
|
|
|
|
</details>
|
|
|
|
### Methods
|
|
|
|
- `setOption` [→](https://echarts.apache.org/en/api.html#echartsInstance.setOption)
|
|
- `getWidth` [→](https://echarts.apache.org/en/api.html#echartsInstance.getWidth)
|
|
- `getHeight` [→](https://echarts.apache.org/en/api.html#echartsInstance.getHeight)
|
|
- `getDom` [→](https://echarts.apache.org/en/api.html#echartsInstance.getDom)
|
|
- `getOption` [→](https://echarts.apache.org/en/api.html#echartsInstance.getOption)
|
|
- `resize` [→](https://echarts.apache.org/en/api.html#echartsInstance.resize)
|
|
- `dispatchAction` [→](https://echarts.apache.org/en/api.html#echartsInstance.dispatchAction)
|
|
- `convertToPixel` [→](https://echarts.apache.org/en/api.html#echartsInstance.convertToPixel)
|
|
- `convertFromPixel` [→](https://echarts.apache.org/en/api.html#echartsInstance.convertFromPixel)
|
|
- `containPixel` [→](https://echarts.apache.org/en/api.html#echartsInstance.containPixel)
|
|
- `getDataURL` [→](https://echarts.apache.org/en/api.html#echartsInstance.getDataURL)
|
|
- `getConnectedDataURL` [→](https://echarts.apache.org/en/api.html#echartsInstance.getConnectedDataURL)
|
|
- `clear` [→](https://echarts.apache.org/en/api.html#echartsInstance.clear)
|
|
- `dispose` [→](https://echarts.apache.org/en/api.html#echartsInstance.dispose)
|
|
|
|
> [!NOTE]
|
|
> The following ECharts instance methods aren't exposed because their functionality is already provided by component [props](#props):
|
|
>
|
|
> - [`showLoading`](https://echarts.apache.org/en/api.html#echartsInstance.showLoading) / [`hideLoading`](https://echarts.apache.org/en/api.html#echartsInstance.hideLoading): use the `loading` and `loading-options` props instead.
|
|
> - `setTheme`: use the `theme` prop instead.
|
|
|
|
### Slots
|
|
|
|
Vue-ECharts allows you to define ECharts option's [`tooltip.formatter`](https://echarts.apache.org/en/option.html#tooltip.formatter) and [`toolbox.feature.dataView.optionToContent`](https://echarts.apache.org/en/option.html#toolbox.feature.dataView.optionToContent) callbacks via Vue slots instead of defining them in your `option` object. This simplifies custom HTMLElement rendering using familiar Vue templating.
|
|
|
|
**Slot Naming Convention**
|
|
|
|
- Slot names begin with `tooltip`/`dataView`, followed by hyphen-separated path segments to the target.
|
|
- Each segment corresponds to an `option` property name or an array index (for arrays, use the numeric index).
|
|
- The constructed slot name maps directly to the nested callback it overrides.
|
|
|
|
**Example mappings**:
|
|
|
|
- `tooltip` → `option.tooltip.formatter`
|
|
- `tooltip-baseOption` → `option.baseOption.tooltip.formatter`
|
|
- `tooltip-xAxis-1` → `option.xAxis[1].tooltip.formatter`
|
|
- `tooltip-series-2-data-4` → `option.series[2].data[4].tooltip.formatter`
|
|
- `dataView` → `option.toolbox.feature.dataView.optionToContent`
|
|
- `dataView-media-1-option` → `option.media[1].option.toolbox.feature.dataView.optionToContent`
|
|
|
|
The slot props correspond to the first parameter of the callback function.
|
|
|
|
<details>
|
|
<summary>Usage</summary>
|
|
|
|
```vue
|
|
<template>
|
|
<v-chart :option="chartOptions">
|
|
<!-- Global `tooltip.formatter` -->
|
|
<template #tooltip="params">
|
|
<div v-for="(param, i) in params" :key="i">
|
|
<span v-html="param.marker" />
|
|
<span>{{ param.seriesName }}</span>
|
|
<span>{{ param.value[0] }}</span>
|
|
</div>
|
|
</template>
|
|
|
|
<!-- Tooltip on xAxis -->
|
|
<template #tooltip-xAxis="params">
|
|
<div>X-Axis : {{ params.value }}</div>
|
|
</template>
|
|
|
|
<!-- Data View Content -->
|
|
<template #dataView="option">
|
|
<table>
|
|
<thead>
|
|
<tr>
|
|
<th v-for="(t, i) in option.dataset[0].source[0]" :key="i">
|
|
{{ t }}
|
|
</th>
|
|
</tr>
|
|
</thead>
|
|
<tbody>
|
|
<tr v-for="(row, i) in option.dataset[0].source.slice(1)" :key="i">
|
|
<th>{{ row[0] }}</th>
|
|
<td v-for="(v, i) in row.slice(1)" :key="i">{{ v }}</td>
|
|
</tr>
|
|
</tbody>
|
|
</table>
|
|
</template>
|
|
</v-chart>
|
|
</template>
|
|
```
|
|
|
|
[Example →](https://vue-echarts.dev/#line)
|
|
|
|
</details>
|
|
|
|
> [!NOTE]
|
|
> Slots take precedence over the corresponding callback defined in `props.option`.
|
|
|
|
### Static Methods
|
|
|
|
Static methods can be accessed from [`echarts` itself](https://echarts.apache.org/en/api.html#echarts).
|
|
|
|
## CSP: `style-src` or `style-src-elem`
|
|
|
|
If you are **both** enforcing a strict CSP that prevents inline `<style>` injection and targeting browsers that don't support the [CSSStyleSheet() constructor](https://developer.mozilla.org/en-US/docs/Web/API/CSSStyleSheet/CSSStyleSheet#browser_compatibility), you need to manually include `vue-echarts/style.css`.
|
|
|
|
## Migration to v8
|
|
|
|
> [!NOTE]
|
|
> Please make sure to read the [upgrade guide](https://echarts.apache.org/handbook/en/basics/release-note/v6-upgrade-guide/) for ECharts 6 as well.
|
|
|
|
The following breaking changes are introduced in `vue-echarts@8`:
|
|
|
|
- **Vue 2 support is dropped:** If you still need to stay on Vue 2, use [`vue-echarts@7`](https://github.com/ecomfe/vue-echarts/tree/7.x).
|
|
|
|
- **Browser compatibility changes:** We no longer provide compatibility for browsers without native [`class`](https://developer.mozilla.org/en-US/docs/Web/JavaScript/Reference/Classes#browser_compatibility) support. If you need to support legacy browsers, you must transpile the code to ES5 yourself.
|
|
|
|
- **CSP entry point removed:** The entry point `vue-echarts/csp` is removed. Use `vue-echarts` instead. You only need to manually include `vue-echarts/style.css` if you are **both** enforcing a strict CSP that prevents inline `<style>` injection and targeting browsers that don't support the [`CSSStyleSheet()` constructor](https://developer.mozilla.org/en-US/docs/Web/API/CSSStyleSheet/CSSStyleSheet#browser_compatibility).
|
|
|
|
## Local development
|
|
|
|
```sh
|
|
pnpm i
|
|
pnpm dev
|
|
```
|
|
|
|
Open `http://localhost:5173` to see the demo.
|
|
|
|
## Notice
|
|
|
|
The Apache Software Foundation [Apache ECharts, ECharts](https://echarts.apache.org/), Apache, the Apache feather, and the Apache ECharts project logo are either registered trademarks or trademarks of the [Apache Software Foundation](https://www.apache.org/).
|